
Sept. 30, 2015
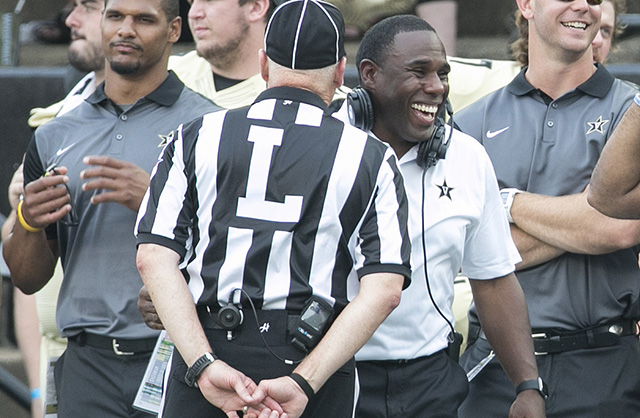
In the offseason, Vanderbilt’s Derek Mason announced that he would serve as the team’s defensive coordinator, in addition to being the head coach. It was a decision that drew a lot of attention due to its uniqueness. Those are two positions typically held by separate individuals, not by one, and there was no shortage of skeptics.
Through four games, Mason’s decision to handle the defensive duties himself couldn’t look much better. Of the Commodores’ first four opponents, three rank in the top 25 nationally for total offense. Against Vanderbilt, all four opponents have been held to season lows in offensive yards and/or points.
The Commodores limited Western Kentucky to a season-low 14 points and 246 yards. The next week, Georgia was held to a season-low 31 points (17 scored against the defense) and 422 yards. Austin Peay’s 144 yards were a season low, as were Ole Miss’ 27 points.
Despite facing three of the nation’s top offensive teams, including the top two in the SEC, Vanderbilt’s defense still ranks in the top half of the league in scoring defense (seventh) and total defense (sixth). Both are significant improvements from where Vanderbilt finished last season.
Take statistics out of it, the improvement is simply noticeable to the naked eye.
The success has come over just four games, so it remains to be seen what the impact will be over the course of an entire season. But a deeper dive into Mason’s history as a defensive coordinator reveals that the numbers are just as impressive when extrapolated to include his three years as defensive coordinator at Stanford.
Since 2011, Mason has served as defensive play caller/defensive coordinator for 45 games, including 41 games at Stanford and four games this season at Vanderbilt.
In 45 games as defensive coordinator, Mason’s defenses have allowed an opponent to match or exceed final season averages in points or offensive yards just six times. That is 13.3 percent, or fewer than two opponents each year. Only one opponent over that span (Arizona, 2012) exceeded season averages in both categories.
During that time, Mason’s defenses have held opponents to 94.38 yards and 13.14 points per game under their season average. Note that when tabulating points allowed, interception returns, fumble returns, kickoff and punt returns for touchdowns were not counted against the defense since they did not occur when the defense was on the field.
In those 45 games, the defense has held the offense to season lows in either yards or points in 19 games. That is 42 percent. Those numbers are somewhat skewed with the inclusion of this year’s four games. But even without the 2015 numbers, Mason’s defenses at Stanford held 36 percent of its opponents to season lows in either yards or points. Over three years, it accounted for five opponents per year having season lows in yards or points.
Statistically, some of the most notable defensive performances for Mason each year were as follows:
- 2013 held Oregon to 253 yards and 25.5 points below their season average.
- 2013 held UCLA to 182.5 yards and 26.9 points below its season average.
- 2012 held Oregon to 35.54 points below its average.
- 2012 held Colorado to 226.75 yards below its average.
- 2011 held Washington State to 213.42 yards below average.
- 2011 held San Jose State to 21.5 points below average.
The numbers speak for themselves. It’s easy to see why Mason decided he would be best suited to run the defense.
Here is a closer look at the defensive success.
45 Games as Defensive Coordinator
- 19x Held opponent to either season low in yards or points, including four this year
- 14x Held opponent to season low in points, including three in 2015
- 14x Held opponent to season low in yards, including three in 2015
- 9x Held opponent to season lows in yards and points
- 94.38 Yards opponents held under season average13.14 Points opponents held under season average
- 1x Opponent had equal/more yards and points than its season average
- 6x Opponent had equal/more yards or points than its season average
- 5x Opponent had equal/more yards than its season average
- 2x Opponent had equal/more points than its season average
2011 (13 games)
- 9.98 Points opponents held under season average
- 87.69 Yards opponents held under season average
2012 (14 games)
- 13.3 Points opponents held under season average
- 87.3 Yards opponents held under season average
2013 (14 games)
- 13.9 Points opponents held under season average
- 102.4 Yards opponents held under season average
2015 (4 games)
- 20.02 Points opponents held under season average
- 112.4 Yards opponents held under season average